How to read a water analysis report
Updated April 20, 2026 — 9 min read
Your lab report gets much easier to read once you do two things first: check the units, then separate health contaminants from nuisance results. A positive bacteria result, nitrate over 10 mg/L, or arsenic over 10 ug/L changes what you should drink right now. Iron at 1.4 mg/L or pH at 6.1 usually points to staining, corrosion, and treatment order instead.
That is the whole game. Do not stare at a page of numbers like every line has equal weight. It doesn’t.
Key takeaway
Read the report in this order: bacteria, nitrate, arsenic or PFAS, pH, then nuisance metals like iron and manganese. If the units are wrong in your head, the number will lie to you.
Start with the units
Most lab reports use four unit styles:
| Unit on report | What it means | Where you usually see it |
|---|---|---|
| mg/L | milligrams per liter; in water this is roughly the same as ppm | nitrate, iron, manganese, sulfate, TDS |
| ug/L | micrograms per liter; roughly the same as ppb | arsenic, lead, copper |
| ng/L | nanograms per liter; roughly the same as ppt | PFAS |
| gpg | grains per gallon | hardness |
The first trap is thinking a smaller-looking unit means a smaller problem. It doesn’t. EPA’s chemical contaminant rules set the arsenic limit at 10 ppb, which is the same thing as 10 ug/L or 0.010 mg/L. Same health issue, three different ways to print it.
Hardness throws people because labs and softener dealers like different units. Minnesota’s Well Owner’s Handbook notes that 1 grain per gallon equals 17.1 mg/L. So if a report says hardness is 205 mg/L, that is about 12 gpg. Softener sizing lives in grains. Most lab reports do not.

Then sort every line into one of three buckets
CDC recommends annual well testing for total coliforms, nitrates, pH, and total dissolved solids. EPA’s drinking water regulations page is the fastest way to see whether a line item is a health standard or a nuisance standard.
Here is the cheat sheet I use:
| Parameter | What the line usually means | Number that matters most |
|---|---|---|
| Total coliform / E. coli | Contamination pathway or fecal contamination | Any positive result deserves attention |
| Nitrate | Health risk, especially for infants | Over 10 mg/L |
| Arsenic | Long-term health risk you cannot taste or smell | Over 10 ug/L |
| PFAS | Dedicated panel only; not on most standard reports | 4 ppt for PFOA and PFOS is the current EPA public-water MCL |
| pH | Corrosion or scale problem, and treatment-order problem | Below 6.5 or above 8.5 |
| Iron | Staining and sediment | Over 0.3 mg/L |
| Manganese | Black staining, dark slime, metallic taste | Over 0.05 mg/L |
| TDS | Overall mineral load | Over 500 mg/L usually means taste or scale issues |
| Sulfate | Taste issues and laxative effect at higher levels | Over 250 mg/L |
That table is why I keep telling well owners not to shop by symptom alone. EPA’s secondary standards page puts iron, manganese, pH, sulfate, and TDS in the non-health, nuisance bucket because they mostly drive taste, odor, color, staining, or plumbing issues. They still matter. They just do not belong in the same urgency bucket as nitrate, arsenic, or E. coli.
The four report codes that confuse everybody
“ND” does not mean the contaminant is impossible. It means the lab did not detect it above the reporting limit for that method. If arsenic shows as ND <2 ug/L, the useful takeaway is that the result is below the lab’s cutoff and below the 10 ug/L EPA standard. Good result. Not proof of absolute zero.
“Positive” and “absent” are not the same as a concentration number. Bacteria lines often come back as positive/negative, present/absent, or MPN-based counts instead of mg/L. Treat any positive E. coli result as a do-not-drink problem until you have a clean retest and a fix. A positive total coliform result is not always a sickness emergency, but it is never a shrug.
“As N” matters. Many nitrate reports say nitrate as nitrogen or NO3-N. The EPA drinking-water limit is 10 mg/L as nitrogen. If your lab uses a different expression, do not freestyle the conversion. Call the lab and ask how that line compares to the drinking-water standard.
Raw-water and treated-water samples answer different questions. A sample pulled after a softener, iron filter, or reverse osmosis unit tells you how the equipment is performing. It does not tell you what is coming out of the well. If you are still learning the sampling side, read how to test well water yourself first, then use where to get well water tested to choose the lab path.

Read the dangerous lines first
If I were looking at your report with you at the kitchen table, I would start here.
Bacteria. CDC says total coliforms are indicator bacteria. They tell you contamination may be getting into the well the same way disease-causing germs can. If the report shows total coliform positive, slow down, verify the sample was collected cleanly, and inspect the wellhead before you spend money on hardware. If E. coli is positive, skip the debate and use a safe water source until the retest and root-cause work are done. The full retest sequence is in coliform bacteria in well water.
Nitrate. Over 10 mg/L is the red line. EPA’s nitrate rule exists because nitrate can cause methemoglobinemia, or “blue baby syndrome,” in infants. This is the line item that changes the conversation fastest if you have a baby in the house. If that number is high, go straight to nitrates in well water.
Arsenic and PFAS. Arsenic over 10 ug/L is a real health problem even if the water looks perfect. EPA’s PFAS page is the current benchmark for PFAS panels: 4 ppt for PFOA and PFOS, plus other PFAS limits on dedicated PFAS testing. Standard county well panels usually do not include PFAS unless you asked for it. If either of those lines is the one bothering you, start with arsenic in well water or testing well water for PFAS.
That is the do-not-wave-off section of the report. Everything else comes after it.
Then read the “your house is paying for this” lines
This is where most treatment shopping starts, and where most treatment mistakes happen.
pH below 6.5 means corrosive water. That can explain metallic taste, blue-green staining, and pinhole leaks. It also changes treatment order. If the water is acidic, the neutralizer often has to come before other equipment.
Iron over 0.3 mg/L explains orange staining, rusty fixtures, and water that turns orange after sitting. Manganese over 0.05 mg/L explains black staining, dark slime, and the residue that makes toilets look dirty again a day after you cleaned them.
Hardness is different. It is not an EPA health limit. It is a cost and comfort number. Once the report is in gpg, you can size a softener correctly and decide whether you are dealing with a soap-scum annoyance or a water-heater-killer. Just do not let hardness distract you from iron, manganese, or low pH if those are on the same report. Those lines can foul or complicate the softener.
A quick example
Say your report shows this:
- Total coliform: absent
- E. coli: absent
- Nitrate: 0.8 mg/L
- Arsenic:
<2 ug/L - pH: 6.1
- Iron: 1.4 mg/L
- Manganese: 0.07 mg/L
- Hardness: 205 mg/L
This is not a do-not-drink emergency based on the bacteria, nitrate, or arsenic lines. It is a corrosive, staining, treatment-order problem. pH is low. Iron and manganese are both over the secondary standards. Hardness at 205 mg/L converts to about 12 gpg, which is firmly in softener territory, but a softener alone is not the first conversation. You would usually be thinking neutralizer first, then iron or manganese treatment, then softening.
That one example is why reading the report in order matters. The wrong order turns a good treatment plan into an expensive plumbing experiment.
What to do next
If you do not have a current lab test, start with the ultimate guide to testing your well water. If you have a report in hand and need help matching numbers to equipment, go straight to the well water filtration guide. For a plain-English contaminant map, the common well water contaminants guide ties symptoms, standards, and treatment together.
Pull your report back out and mark it in three colors: red for health contaminants, orange for corrosion or staining problems, and green for lines that came back clean. You can make good treatment decisions from that page once the urgent lines are separated from the nuisance lines. Until then, it is just a wall of numbers.
Related guides
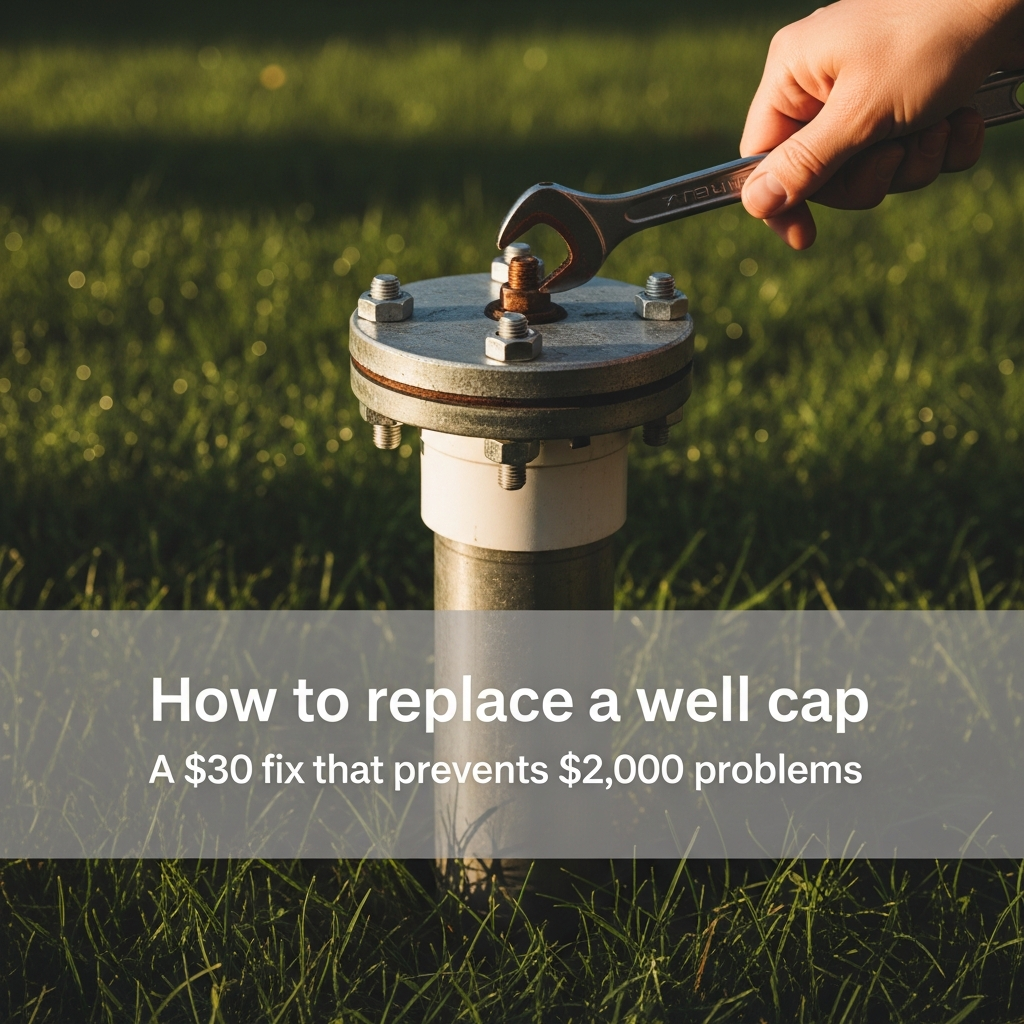
How to replace a well cap (and why a damaged cap is an emergency)
A cracked or loose well cap is the most common pathway for bacteria, insects, and surface water to enter your well. Here's how to inspect yours, measure for a replacement, and install it yourself.
6 min read
Radon in well water: aeration vs. charcoal filtration
Radon in well water is an invisible cancer risk that standard filters miss. Here's how aeration and GAC filtration compare on removal rates, costs, and the radioactive waste problem most installers won't mention.
10 min read
How to choose the right filtration system for your well water
A water-chemistry-first guide to well water filtration by contaminant -- iron bacteria, sulfur, PFAS, manganese, and more. How to test your water, read the results, match each problem to the right filter technology, and build a treatment train that solves your specific issue.
14 min read